
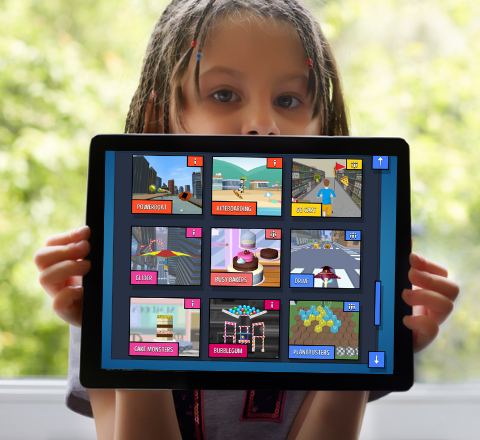
Games-based learning
Virtual rewards and instant feedback engage and motivate your students to enjoy their learning. Now with over 30 games to choose from!
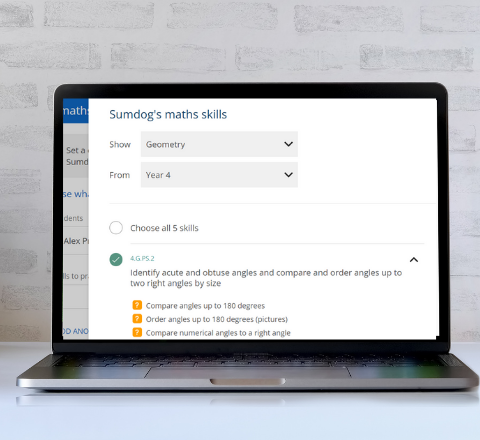
Personalized practice
Set differentiated practice for groups or individuals to keep everyone together and reduce any anxiety around math ability. Supports math mastery!
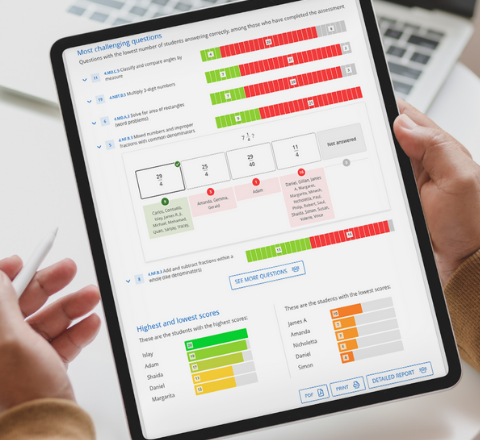
Assess and analyze
Use our ready-made informal online tests to make assessing easy for you and fun for your class. You can even build your own!
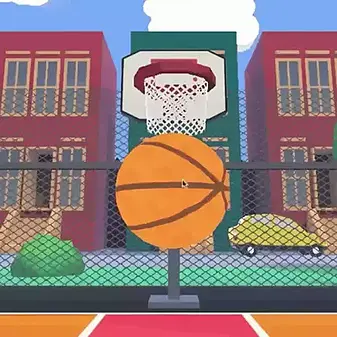
Basketball
Time to shoot some hoops! How many shots can you make from the 3 point line? Suitable for children age 7 and above who like sports based games.
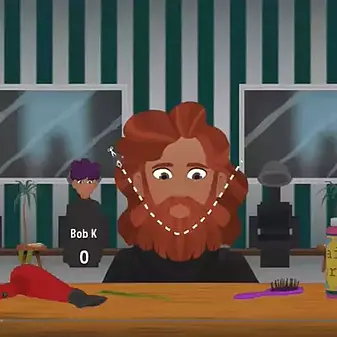
Trim time
You have lots of hair cuts to do! Follow the guidelines to trim hair in the way people request to get a point. Suitable for all ages.
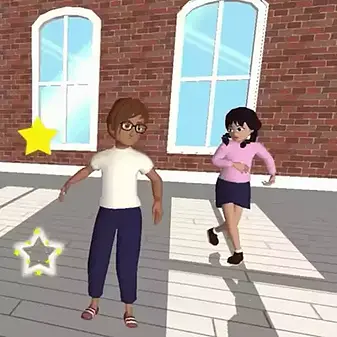
Dance
Dance in time with the stars and show off your awesome moves! Now with new dance moves and music, as well as the 3D avatar. Great for kids of all ages.
"I'd recommend Sumdog because it's easy to use, you can seamlessly integrate it into your curriculum and the data it offers is really useful - it gives you both a broad overview as well as specific details!"
Andrew Esterline
Teacher, Tekonsha Community Schools, Michigan, US


An instant hit!
“After the first day of using the program, I knew it was an instant hit. The next day my students were eagerly asking, well, begging really, to use the program again.”
Sherri Oliver
Teacher, Mount Vernon Community School, VA, USA
A great educational game!
“This program targets several objectives at one time. My ELD students are the ones that are benefiting from it the most - they are spelling, listening and writing all in one game. This is a great educational game.”
Noemi Escalante
Teacher, Clawson Elementary School, AZ, USA